
Realtime Charts for Torque Pro
Screenshots


Description
About Realtime Charts for Torque Pro Feature
Realtime Charts for Torque Pro is a specialized plugin application designed to enhance the Torque Pro OBD2 diagnostic tool. It transforms raw vehicle data into dynamic, real-time graphical visualizations, providing car enthusiasts, DIY mechanics, and performance drivers with an intuitive window into their vehicle's inner workings. By connecting to an ELM327 Bluetooth adapter, it leverages Torque Pro's data stream to render detailed charts and graphs for parameters like RPM, speed, coolant temperature, and boost pressure. This app serves as a powerful analytical companion, turning a smartphone or tablet into a sophisticated digital dashboard and diagnostic scanner that goes beyond simple code reading, enabling deep performance monitoring and analysis.
Chapter 1: Function
The core function of Realtime Charts for Torque Pro is to generate and display live, customizable graphs from the OBD2 data acquired by the Torque Pro app. Once the plugin is activated, it intercepts the real-time data stream—comprising hundreds of potential PID parameters—and visually plots selected metrics against time or each other. Users can create multiple chart layouts, choosing which gauges to graph, such as engine load versus fuel trim or intake manifold pressure across RPM. The application allows for extensive customization of chart appearance, including line colors, scales, grid density, and background themes. It operates seamlessly in the background of Torque Pro, updating charts continuously as the vehicle runs, enabling users to spot trends, correlations, and anomalies that would be difficult to discern from numerical gauges alone. This graphical representation is fundamental for detailed performance logging and immediate feedback during diagnostics or tuning sessions.
Chapter 2: Value
The primary value proposition of Realtime Charts for Torque Pro lies in its ability to convert complex automotive data into actionable visual insights, thereby elevating the utility of the standard Torque Pro app. Its key advantage is the enhancement of diagnostic clarity and performance analysis. While Torque Pro displays data primarily in digital gauge form, this plugin's graphical approach allows users to immediately visualize relationships between parameters—for instance, seeing how throttle position correlates with air-fuel ratio over time, which is crucial for identifying inefficiencies or potential faults. This visual diagnostic capability can lead to faster, more accurate problem-solving, saving time and money on repairs. For performance tuning, the value is immense; enthusiasts can graph boost curves, monitor vitals during a pull, and log data for post-run analysis to fine-tune their vehicles safely. The app adds a layer of professional-grade telemetry to an affordable, accessible platform. Furthermore, its user-customizable interface ensures that both casual users and serious gearheads can tailor the display to show only the most relevant information, reducing clutter and focusing attention. By providing a clear historical record of vehicle behavior, it also aids in preventative maintenance, helping users spot gradual degradation in systems before they lead to failures. In essence, it transforms a smartphone into a powerful vehicular data analysis tool, democratizing access to information once reserved for high-end scan tools or dyno equipment.
Chapter 3: Scenarios
The primary target users for Realtime Charts for Torque Pro are automotive DIYers, performance enthusiasts, and semi-professional mechanics. For the DIY car owner, the app is invaluable during routine maintenance or when a check engine light appears. They can use it to graph oxygen sensor voltages over a drive cycle to confirm proper operation or monitor fuel system trims to diagnose a rough idle before visiting a shop. Performance enthusiasts and tuners represent a core user group. They rely on the real-time charts to visualize boost pressure build-up, track exhaust gas temperatures during modifications, and analyze throttle response after installing new parts. It's commonly used during track days or dyno sessions to log critical data without investing in expensive standalone gauges. Another key scenario is for owners of modified vehicles, such as turbocharged cars, who need to vigilantly monitor engine parameters to prevent damage. The app allows them to set up a custom dashboard with graphs for knock sensor activity and intake air temperature, providing peace of mind during spirited driving. Additionally, it serves educators and students in automotive vocational programs as a practical tool for demonstrating engine dynamics and diagnostic procedures in a clear, visual format. In everyday use, it turns any commute into an opportunity to monitor vehicle health and efficiency, making advanced data analysis a seamless part of the driving experience.
Uninstall Instructions
For step-by-step guidance on how to safely remove this application from your device, please refer to our 《Uninstall Instructions》 document.
Pros
- displays OBD2 sensor data as real-time gauges and charts
- customizable dashboard with drag-and-drop widget placement
- logs data directly to phone storage for offline analysis
- supports high-speed data polling via ELM327 Bluetooth adapters
- creates custom math channels for derived parameter calculations
Cons
- requires a separate Torque Pro app license to function
- initial widget configuration has a steep learning curve
- high polling rates can drain smartphone battery quickly
- chart smoothing lacks adjustable algorithm selection
- no built-in preset dashboards for common vehicle models
Frequently Asked Questions
What is Realtime Charts for Torque Pro?
Realtime Charts for Torque Pro is a companion Android app designed to visualize vehicle data in real-time. It connects to the popular 'Torque Pro' OBD2 app via Bluetooth, receiving live engine diagnostics from an OBD2 adapter plugged into your car. Its core function is to display this data—like RPM, speed, coolant temperature, and boost—as dynamic, customizable graphs and charts, providing a clearer visual analysis than just numerical gauges.
Is the app free to use or are there in-app purchases?
null
What devices and systems are compatible with this app?
This app is designed for Android devices. It requires a smartphone or tablet running Android OS and must be used in conjunction with the 'Torque Pro' app. Compatibility also depends on having a supported ELM327-based Bluetooth OBD2 adapter connected to your vehicle's diagnostic port. The app itself does not directly connect to the car's computer.
How does it differ from the charts in Torque Pro itself?
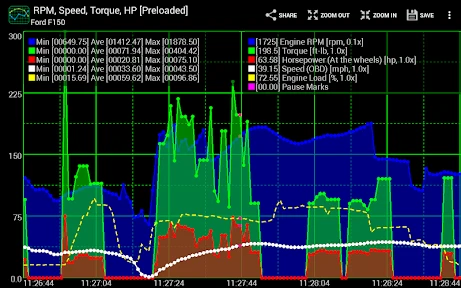
While Torque Pro offers basic graphing, this dedicated app provides advanced, high-performance charting with superior visualization. Key features include smoother real-time rendering, the ability to display multiple data parameters on a single synchronized chart, custom color schemes, and enhanced zoom/pan controls for detailed post-drive analysis. It acts as a powerful visualization extension to the core logging functionality of Torque Pro.
Why can't the app connect to Torque Pro or my car?
Connection issues are typically not with this app itself. First, ensure 'Torque Pro' is installed, has a valid license, and is actively connected to your OBD2 adapter and vehicle. This app only receives data from Torque Pro. Common problems include a faulty Bluetooth pairing with the adapter, an incompatible OBD2 adapter, or a vehicle diagnostic port that doesn't support all PID data. Check Torque Pro's connection status first.
App Info
Technical Info
Recommended For You

Joist Invoices for Contractors
Business

Figma: view. comment. mirror.
Art & Design

SMS Auto Reply - Autoresponder
Communication

Driving Instructor-Theory Test
Auto & Vehicles

Chumba Casino Real Money ayuda
Comics

Solo: Your Gig Business App
Business

Car Engine Sounds - Gas Pedal
Auto & Vehicles

Meeting - Video Meeting
Communication

Sketchbook
Art & Design

Pocket Novel
Books & Reference

Bible Chat: Holy Bible Study
Books & Reference

iDraw
Art & Design

کتابراه: کتاب الکترونیک و صوتی
Books & Reference

Grubhub for Drivers
Business

Kling AI: AI Image&Video Maker
Art & Design

Tattoo Simulator Tattoo Maker
Art & Design

MediBang Paint:Draw Art, Comic
Art & Design

VirtuNum - Virtual Number
Communication

2ndLine - Second Phone Number
Communication

Magic Doodle: Glow Art Drawing
Art & Design